Below is a small selection of maps I created for various GIS projects.
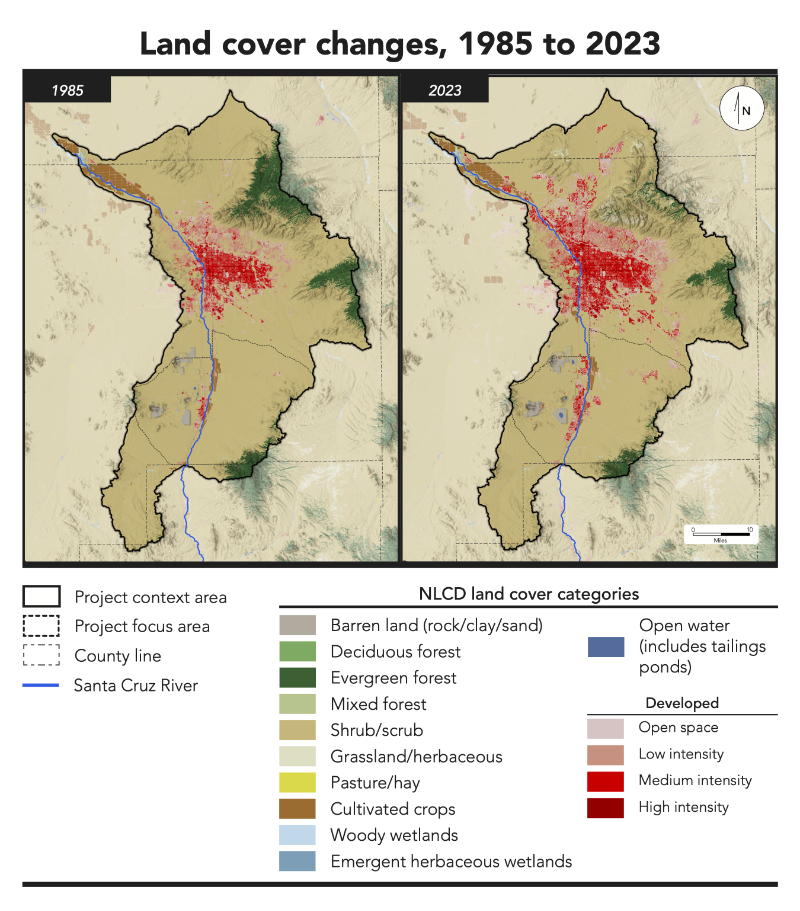
The map below, created for the Middle Santa Cruz River riparian restoration planning project, shows land cover change in the project area between 1985 and 2023. Urban/suburban growth and loss of forest cover in the Santa Catalina rage are clearly visible. Created using data from the NLCD (National Land Cover Dataset).
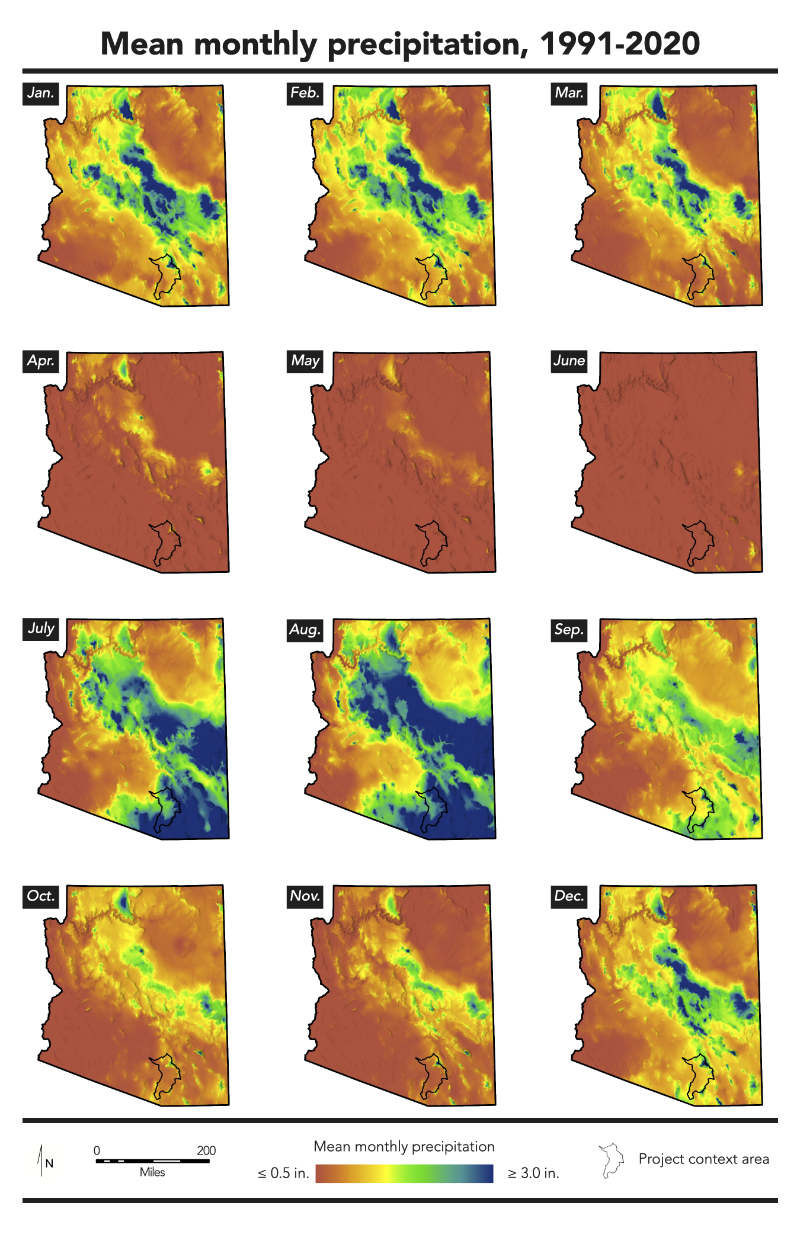
Statewide seasonal precipitation patterns in Arizona are clearly visible across this series of monthly precipitation maps. The project area — the Tucson-area watershed — is shown in the southeast portion of the state. This series was created using PRISM 30-year precipitation normals (1991-2020) for the Middle Santa Cruz River riparian restoration planning project.
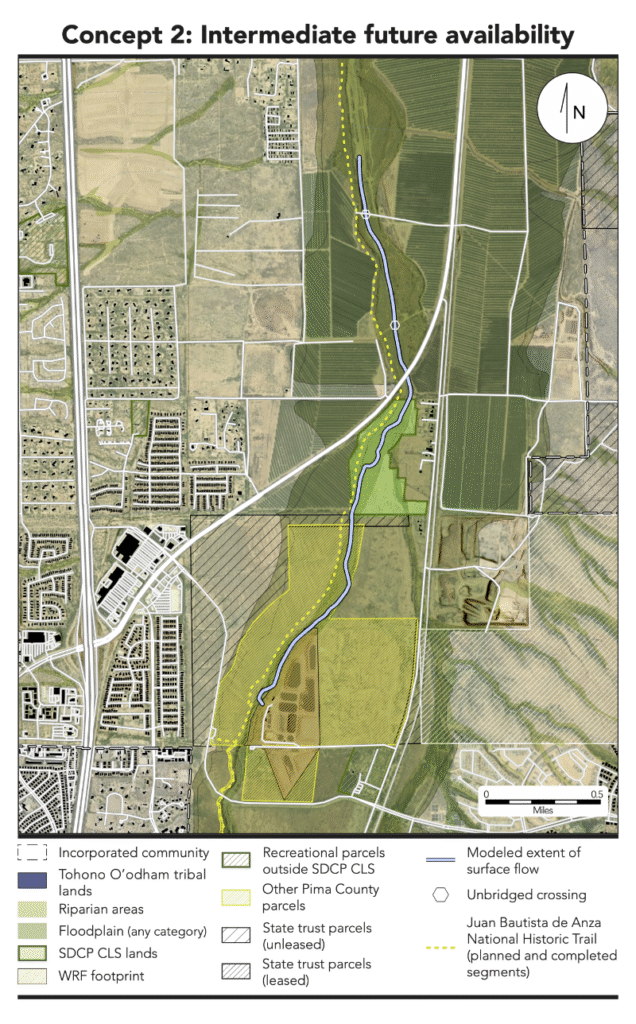
Work on the the Middle Santa Cruz River riparian restoration planning project included the creation of future flow concepts under a variety of scenarios. This map shows the projected extent of surface flow for one such concept, as well as surrounding land uses.
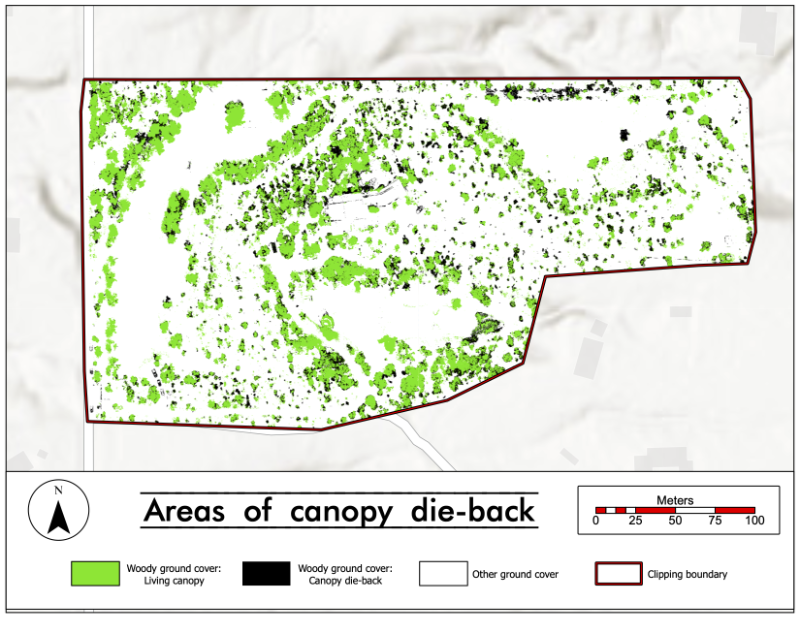
The map below shows living tree canopy and canopy die-back at a parcel near Tucson’s wildland-urban interface. After planning and flying a UAS image acquisition mission with a Mavic 3, I post-processed images to create an orthophoto, digital elevation and terrain models, and a 3D photogrammetric model. I then trained and validated an image-classification model capable of distinguishing between healthy tree canopy and areas of die-back. The model incorporated elevation data and was capable of distinguishing dead and down trees from dead canopy.
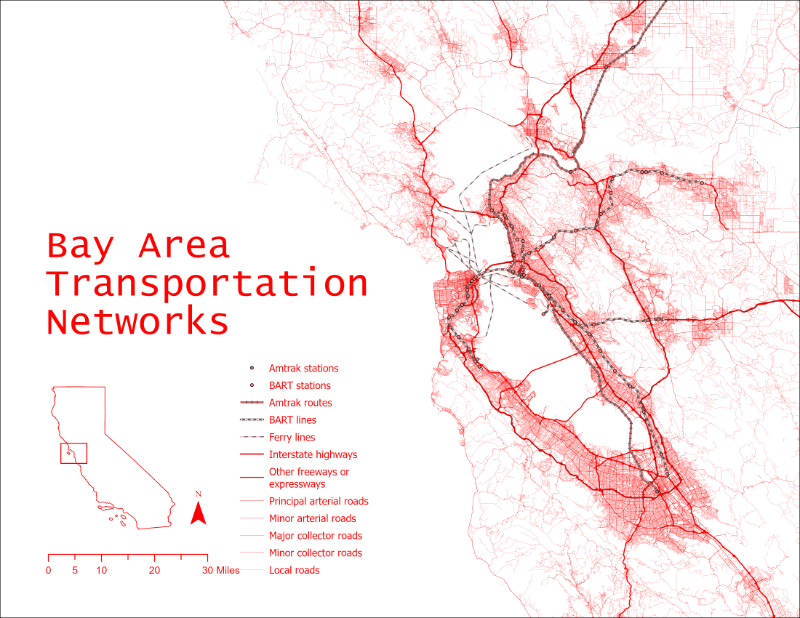
The landmasses and settlement patterns of the San Francisco Bay area are evident from transportation networks alone. This map is inspired by Auckland Transport Network by David Sherman.